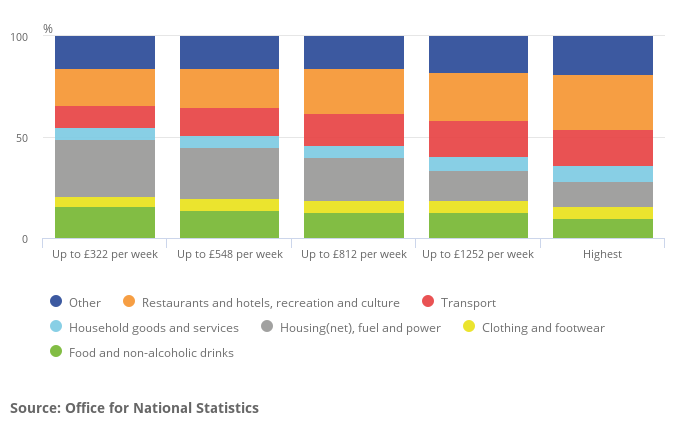
The poorest 20% of households now spend over 43% of their total spending on food, housing and utilities.
Government figures show that in the latest quarter, income and spending continue to increase, with a slowdown of household conditions, as well as a levelling off of people’s personal well-being and a worsening perception of the future.
These trends may not necessarily be equally distributed across different parts of society; for example, between 2011 and 2016 financial years, the average income for the bottom 20% of households increased by 4.8% or £589 while for the top 20% it increased by 6.7% or £4,123.
However, overall, people perceive the economy and their personal financial situation will worsen over the next 12 months, continuing more pessimistic views seen since the beginning of 2018.

For the full ONS figures, click HERE.
Search Jungle Drums
Categories:
- Finance & Mortgages 9
- Legislation & Compliance 24
- News from The Jungle Drums 134
- Portfolio 1
- Property Market 57
- Proptech & Innovation 72
- Sales & Marketing 95
- Uncategorized 14